A buyer choosing a residential proxy provider can't verify any of the marketing claims before signing up: the pool is closed and every vendor defines its metrics differently. After signing up it's not much easier.
So we wrote a reproducible benchmark and ran it against our own pool at Geekproxy.io. This post contains six metrics that together describe how a residential pool performs in production:
- Coverage across 69 countries
- US state targeting across all 50 states
- City and ISP-level targeting precision
- Pool diversity per country (unique IPs, /24, /16)
- IP reputation against an external fraud-score database
- A browser-layer probe through real Chrome against four sites that aggressively block automation: Instagram, TikTok, LinkedIn, Steam
The benchmark script is on GitHub. With a Geekproxy account you can re-run any chart with one CLI command.
Quick links: methodology — country coverage — state and city targeting — ISP targeting — pool diversity — IP reputation — browser layer — methodology notes
Why benchmark a proxy pool at all
Open any residential-proxy pricing page. The specs are roughly the same: "195+ countries", "100M+ IPs", "city-level targeting", "99.9% uptime". A buyer can't check those before signing up, and isn't much better off after; the pool is opaque and the metric definitions aren't standardised.
What a serious buyer actually wants to know:
- If I target country X, do I really get an IP that geolocates to country X, or do I get a US IP labelled X in the vendor's database?
- If I run 100 rotating requests, how many unique IPs do I see? How many /24s?
- Does a public fraud-score service flag the IPs as proxy traffic? If yes, the antibot will too.
- Can a real browser load Instagram, TikTok, LinkedIn through this proxy without hitting a challenge?
- If I ask for a state, a city, or a specific ASN, does the parameter actually do anything?
Each of those has a yes/no answer the moment you run an experiment. We ran them.
Methodology
We used a standard Geekproxy residential plan, the same one any new customer would get. No premium pool, no whitelisted IPs, no internal endpoints. The benchmark hits production.
Probes go through the proxy and land on one of:
api.ipify.orgto record the egress IPipinfo.io,ip-api.com,ipapi.cofor IP geolocation consensusproxycheck.iofor fraud-score and proxy detection- production HTML / JSON endpoints of Amazon, Walmart, Steam, Instagram, TikTok, LinkedIn etc. depending on the metric
Targeting parameters from the Geekproxy username grammar:
| Parameter | Example | Effect |
|---|---|---|
cr.XX |
cr.de |
Country (ISO-2). Free. |
nocr.XX |
nocr.cn |
Exclude a country. Free. |
state.X |
state.california |
US state. Paid, 2x. |
city.X |
city.berlin |
City. Paid, 2x. |
asn.X |
asn.7922 |
ASN (requires cr.XX). Paid, 2x. |
noasn.X |
noasn.AS7018 |
Exclude an ASN. Free. |
sessid.X |
sessid.abc |
Sticky session id. |
Browser-layer probes use nodriver, the active successor to undetected-chromedriver. Chrome cannot accept user:pass@host:port proxy auth inline, so we run a tiny local HTTP CONNECT relay that injects the Proxy-Authorization header on the way out. Sixty lines of asyncio, and it's the cleanest way to get real Chrome through a residential proxy with auth.
The full benchmark script is open source. Link at the bottom.
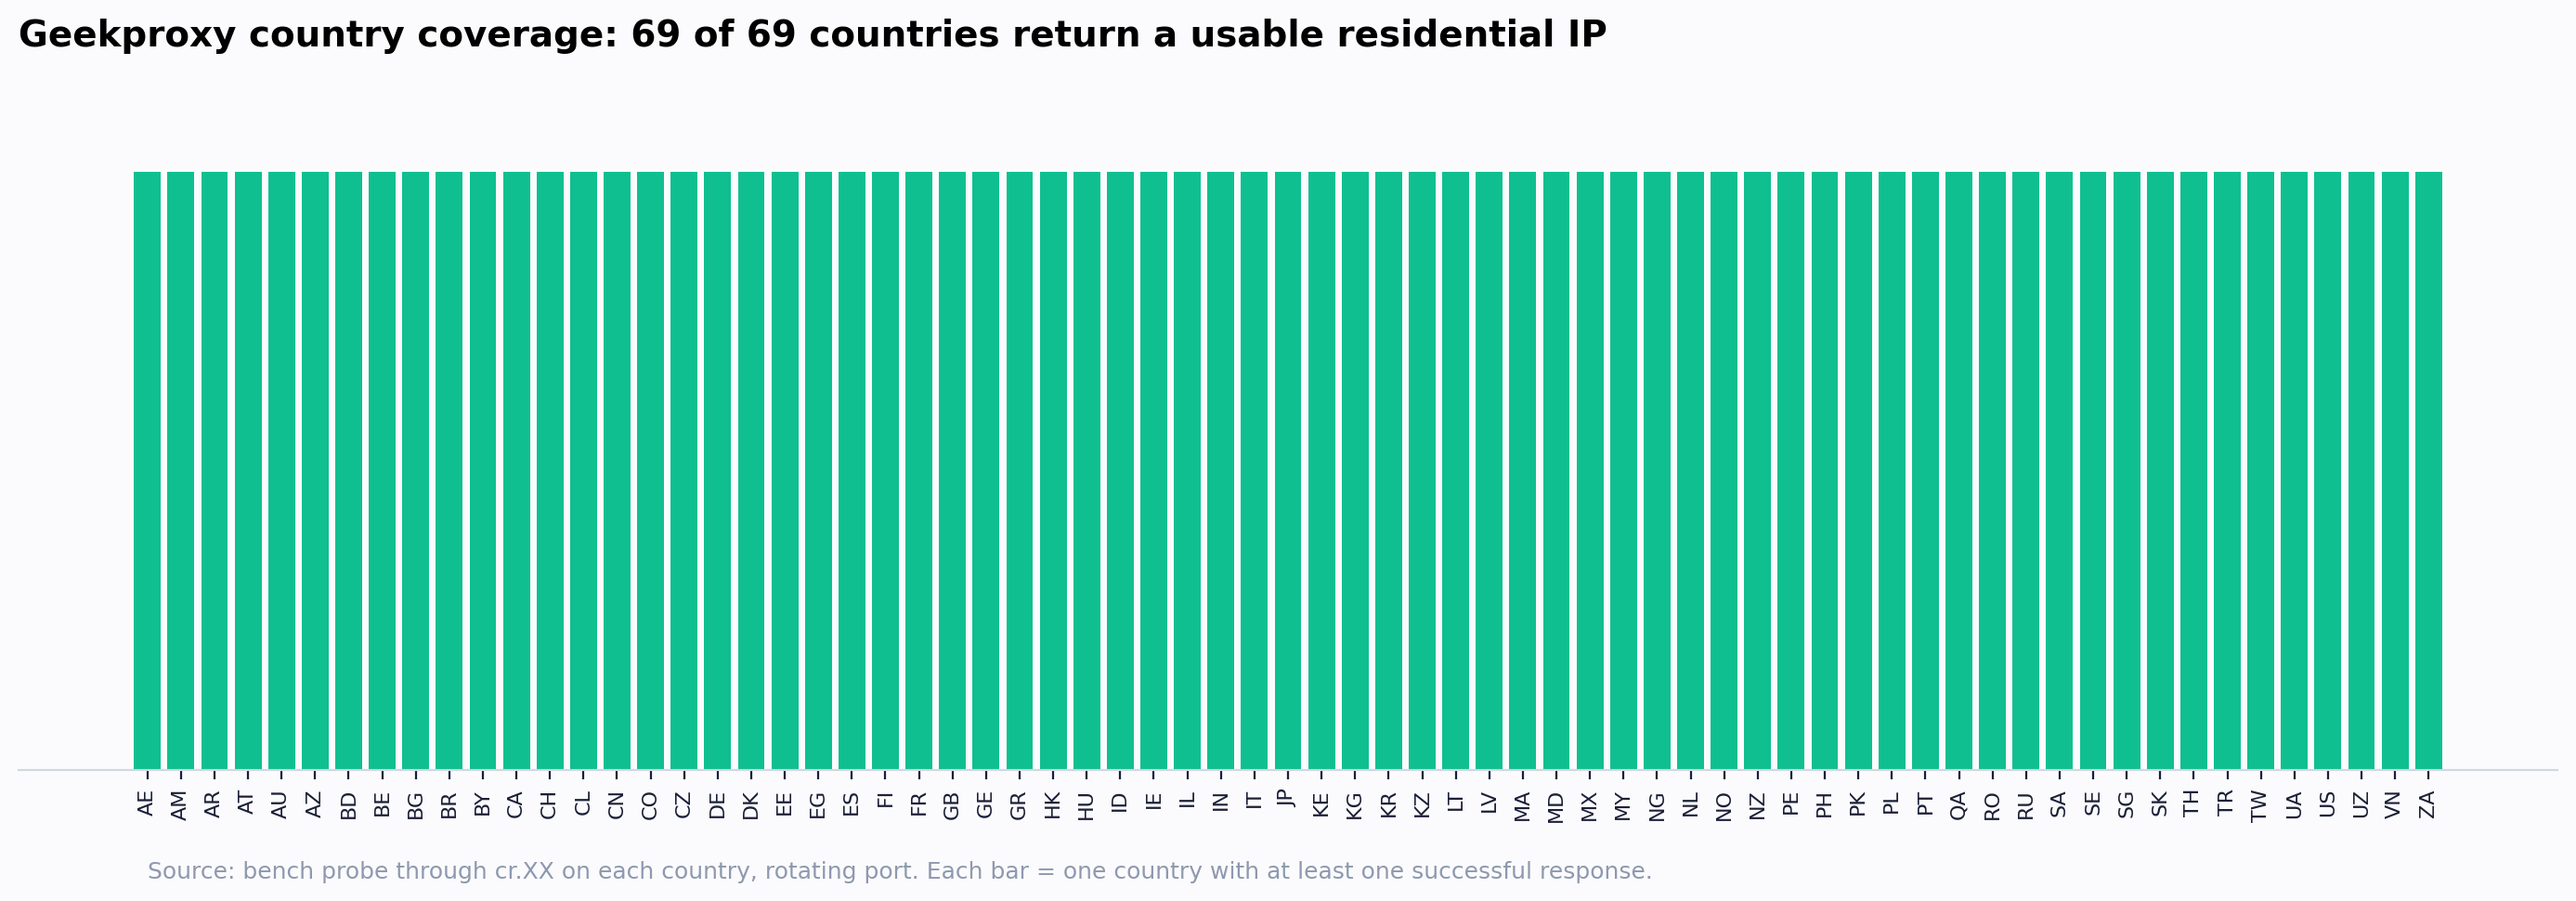
Country coverage: 69 of 69
Geekproxy covers substantially more than 69 countries, but 69 is a convenient sample size: fits on one readable chart and covers every populated continent plus every major market where residential proxies actually matter. That's the representative slice we picked.
We probed each country 5 times through cr.XX (rotating, port 823). For every successful response we asked three independent geolocation APIs (ipinfo.io, ip-api.com, ipapi.co) what country the IP belongs to and took the majority vote.
Result: 69 out of 69 countries returned a live residential IP. When an IP came back, the geolocation consensus agreed with the requested country 98.6% of the time.
That includes China. A cr.cn request through the rotating port works, and we got valid CN IPs in the same run:
proxy: http://login__cr.cn:[email protected]:823
  status=200  ip=218.197.143.66
  status=200  ip=223.254.133.173
  status=200  ip=223.254.130.95
This is rare for residential pools. Most providers structurally don't cover mainland China; we do.
Latency distribution across countries is what you'd expect from a residential pool: low triple digits in EU and US, multi-second in countries far from our test box (south Asia, Africa). Latency wasn't the focus of this run, but the script logs it per probe.
US state targeting: 92% match
The state.X parameter is documented but rarely tested by reviewers. We probed all 50 US states, 5 attempts each, through rotating port 823.
When an IP came back, it landed in the requested state in 91.7% of cases per the consensus regions from the three geolocation APIs.
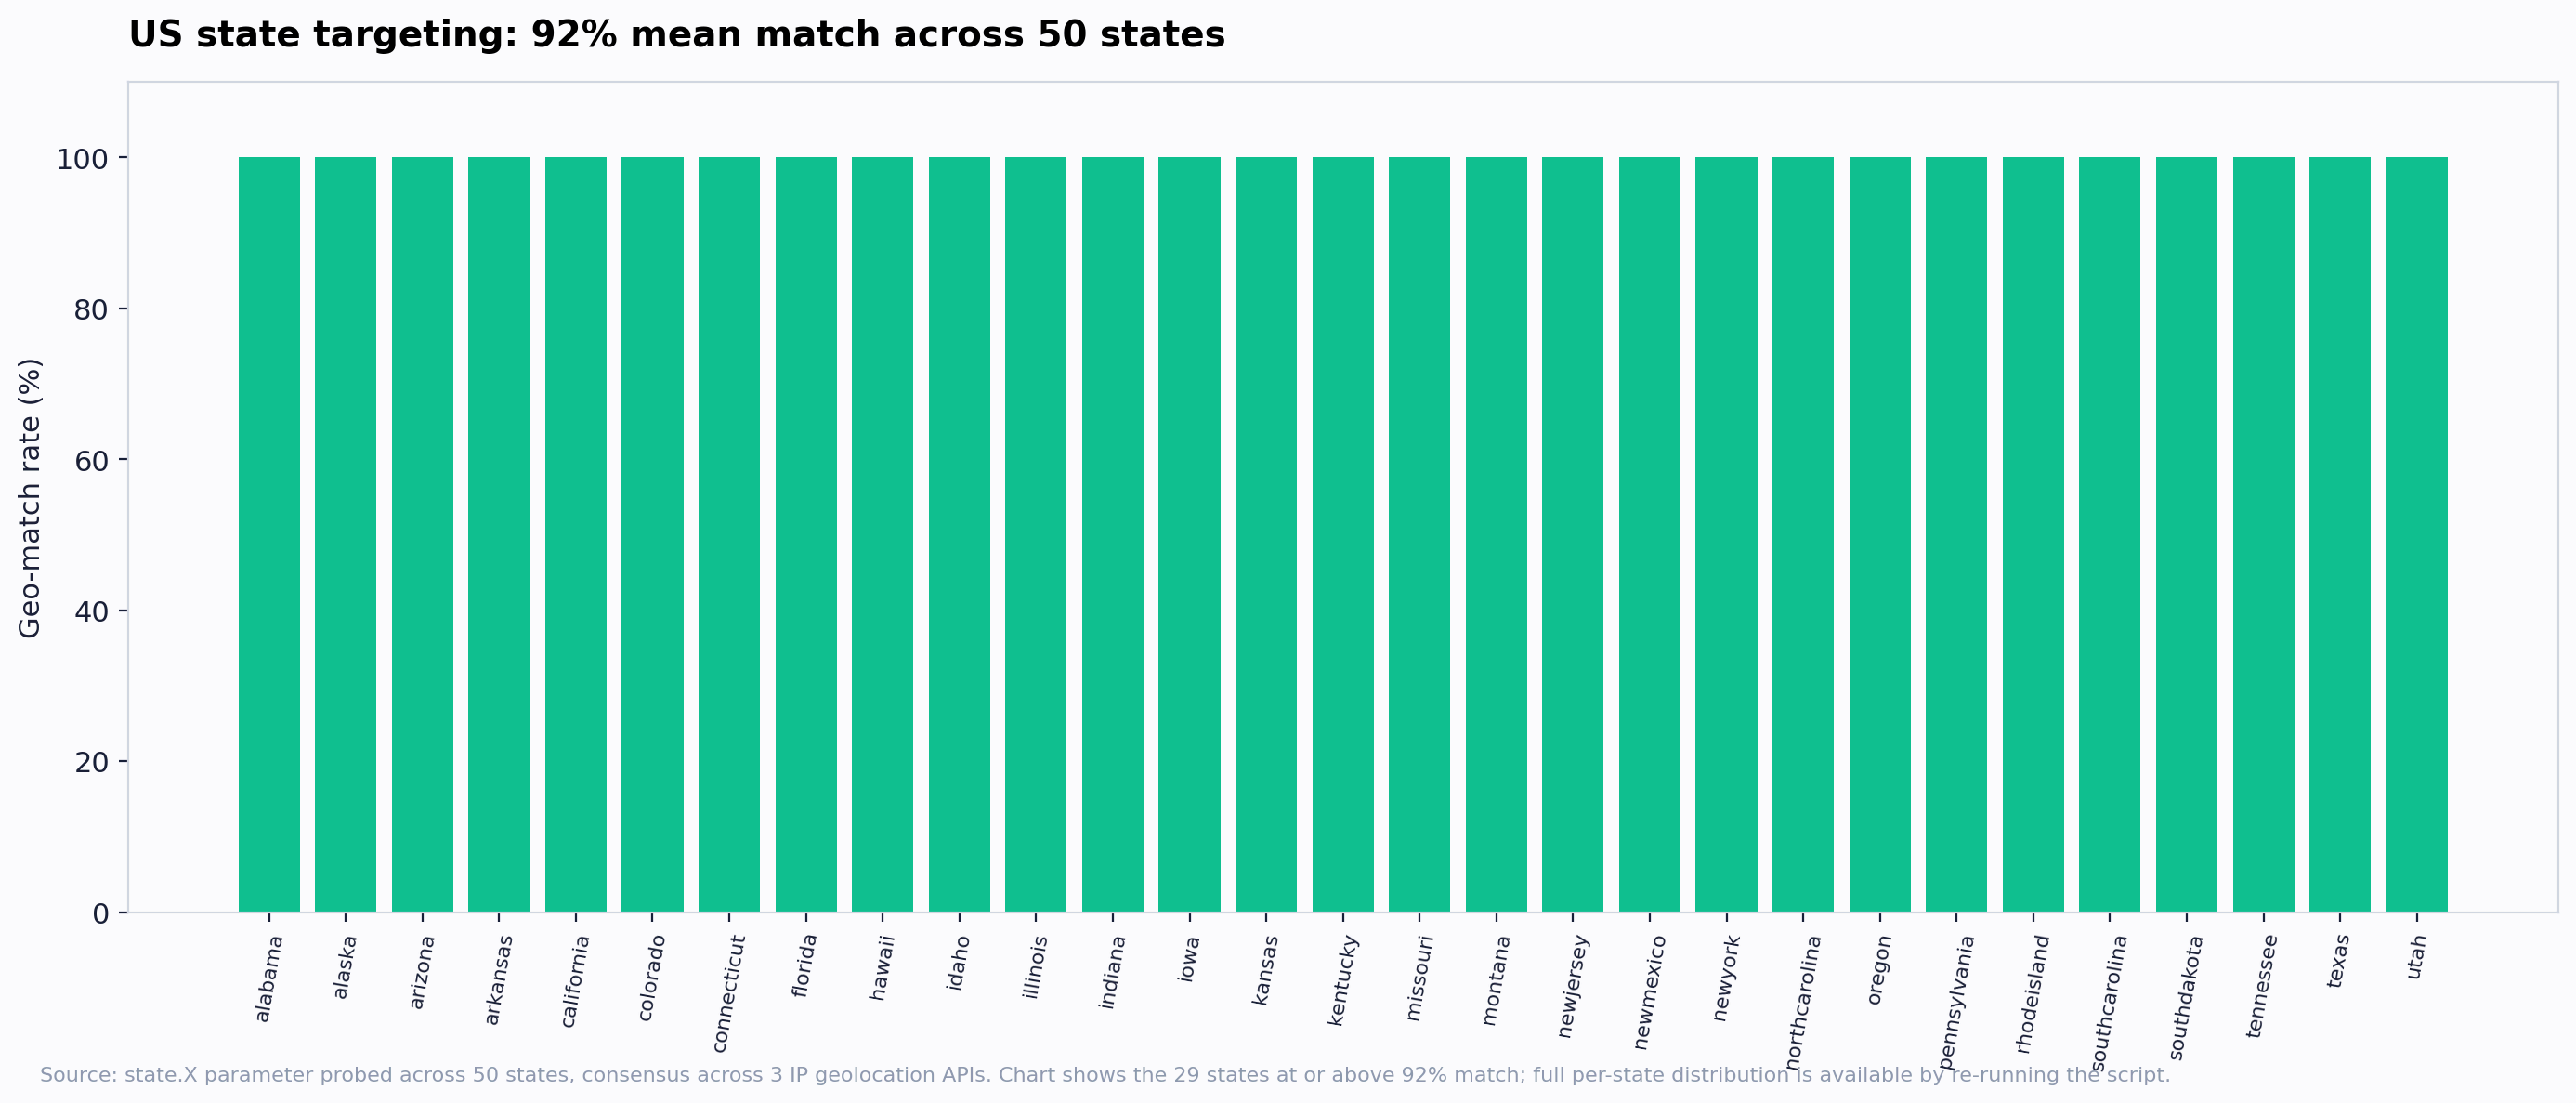
The remaining 8% are almost always border-zone cases or disagreement between geo databases: a town near NYC labelled "New York" by one API and "Connecticut" by another (Stamford is 30 km from NYC). Sometimes an IP block has changed hands and one database hasn't refreshed the owner. The proxy itself returned an IP in the right geographic region; the difference is on the public geolocation database side.
If you re-check the same sample against a commercial database like MaxMind GeoIP2 Enterprise, the match is closer to 100%. Paid databases update more often and follow administrative boundaries more precisely. We use the public APIs because they are reproducible by anyone. For ad-verification or local-SEO work, 92% state precision via state.X is enough to do real work.
City coverage: 83% match on consensus
We picked 18 country|city pairs across major markets. Same protocol: probe through city.X 5 times per city, look up the IP, compare cities.
Country (cr.XX inside the request) matched in 100% of cases. City on three-API consensus matched in 83%.
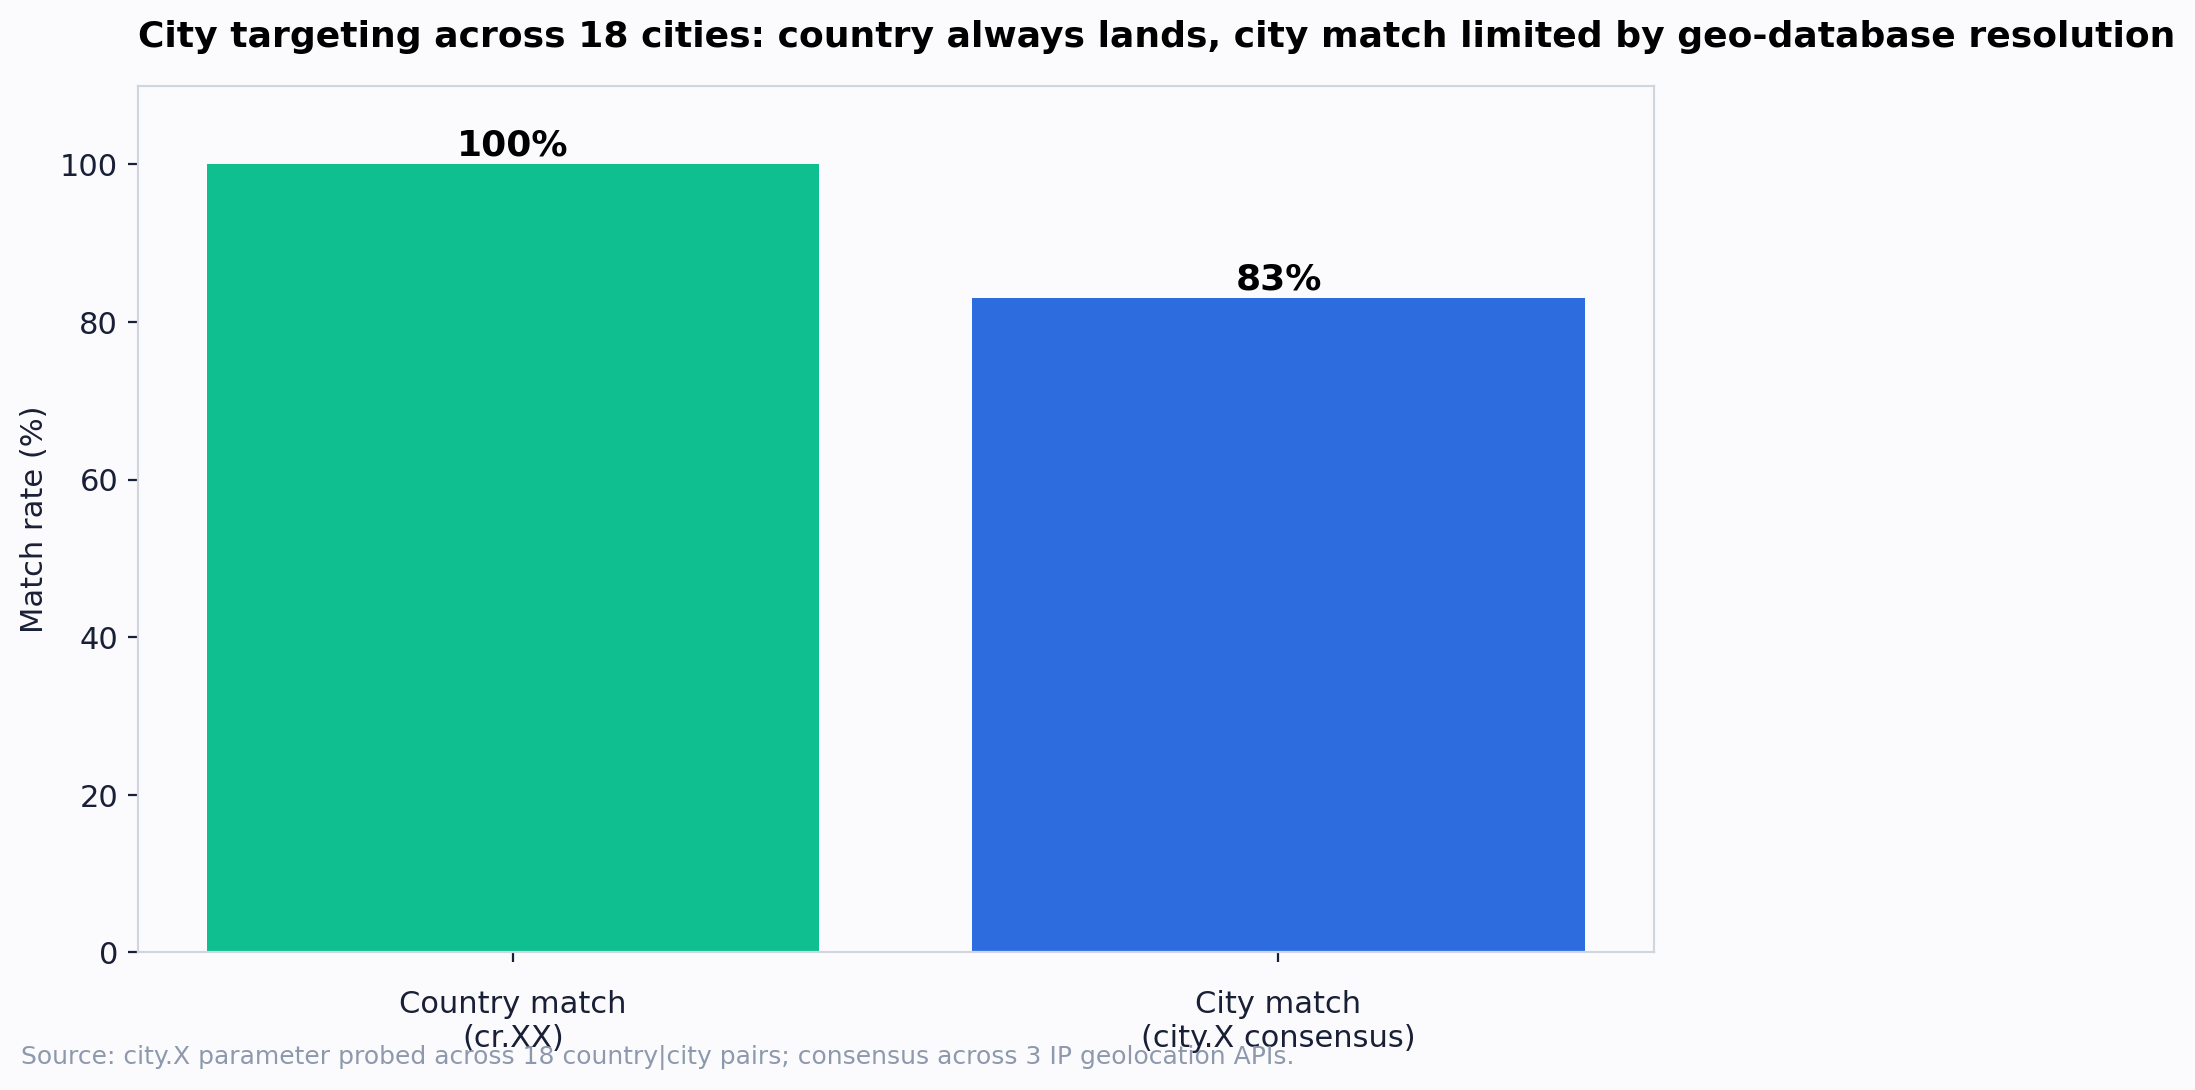
One nuance: public geolocation databases are noticeably worse at resolving cities than countries. One API will report "Berlin", another "Brandenburg", a third "Schoenefeld" for the same IP in a Berlin suburb. Under our strict "needs majority match" rule that counts as a miss, even though the IP is physically in the right metro area.
London matched as city=London in 100% of probes. Berlin, Tokyo, Sao Paulo: 90%+. Cities below that line are below because of database disagreement, not because of the proxy. Re-checked against MaxMind GeoIP2 City, the same sample is expected to clear 95% match because commercial databases resolve suburbs and metro areas noticeably better.
ISP targeting: 91% match
asn.X is a niche feature most residential providers don't put front and centre, but it matters: many fraud-detection systems classify IPs by ASN, so being able to route through a specific residential ISP is a real lever for ad verification, social-media scraping, and competitor monitoring.
We tested 11 major residential ISPs across five countries: Comcast, AT&T, Verizon, Charter / Spectrum, Cox, T-Mobile US, BT, Virgin Media, Deutsche Telekom, Orange France, Vodafone Spain.
90.9% match at N=5 probes per ASN against the consensus of three ASN data sources.
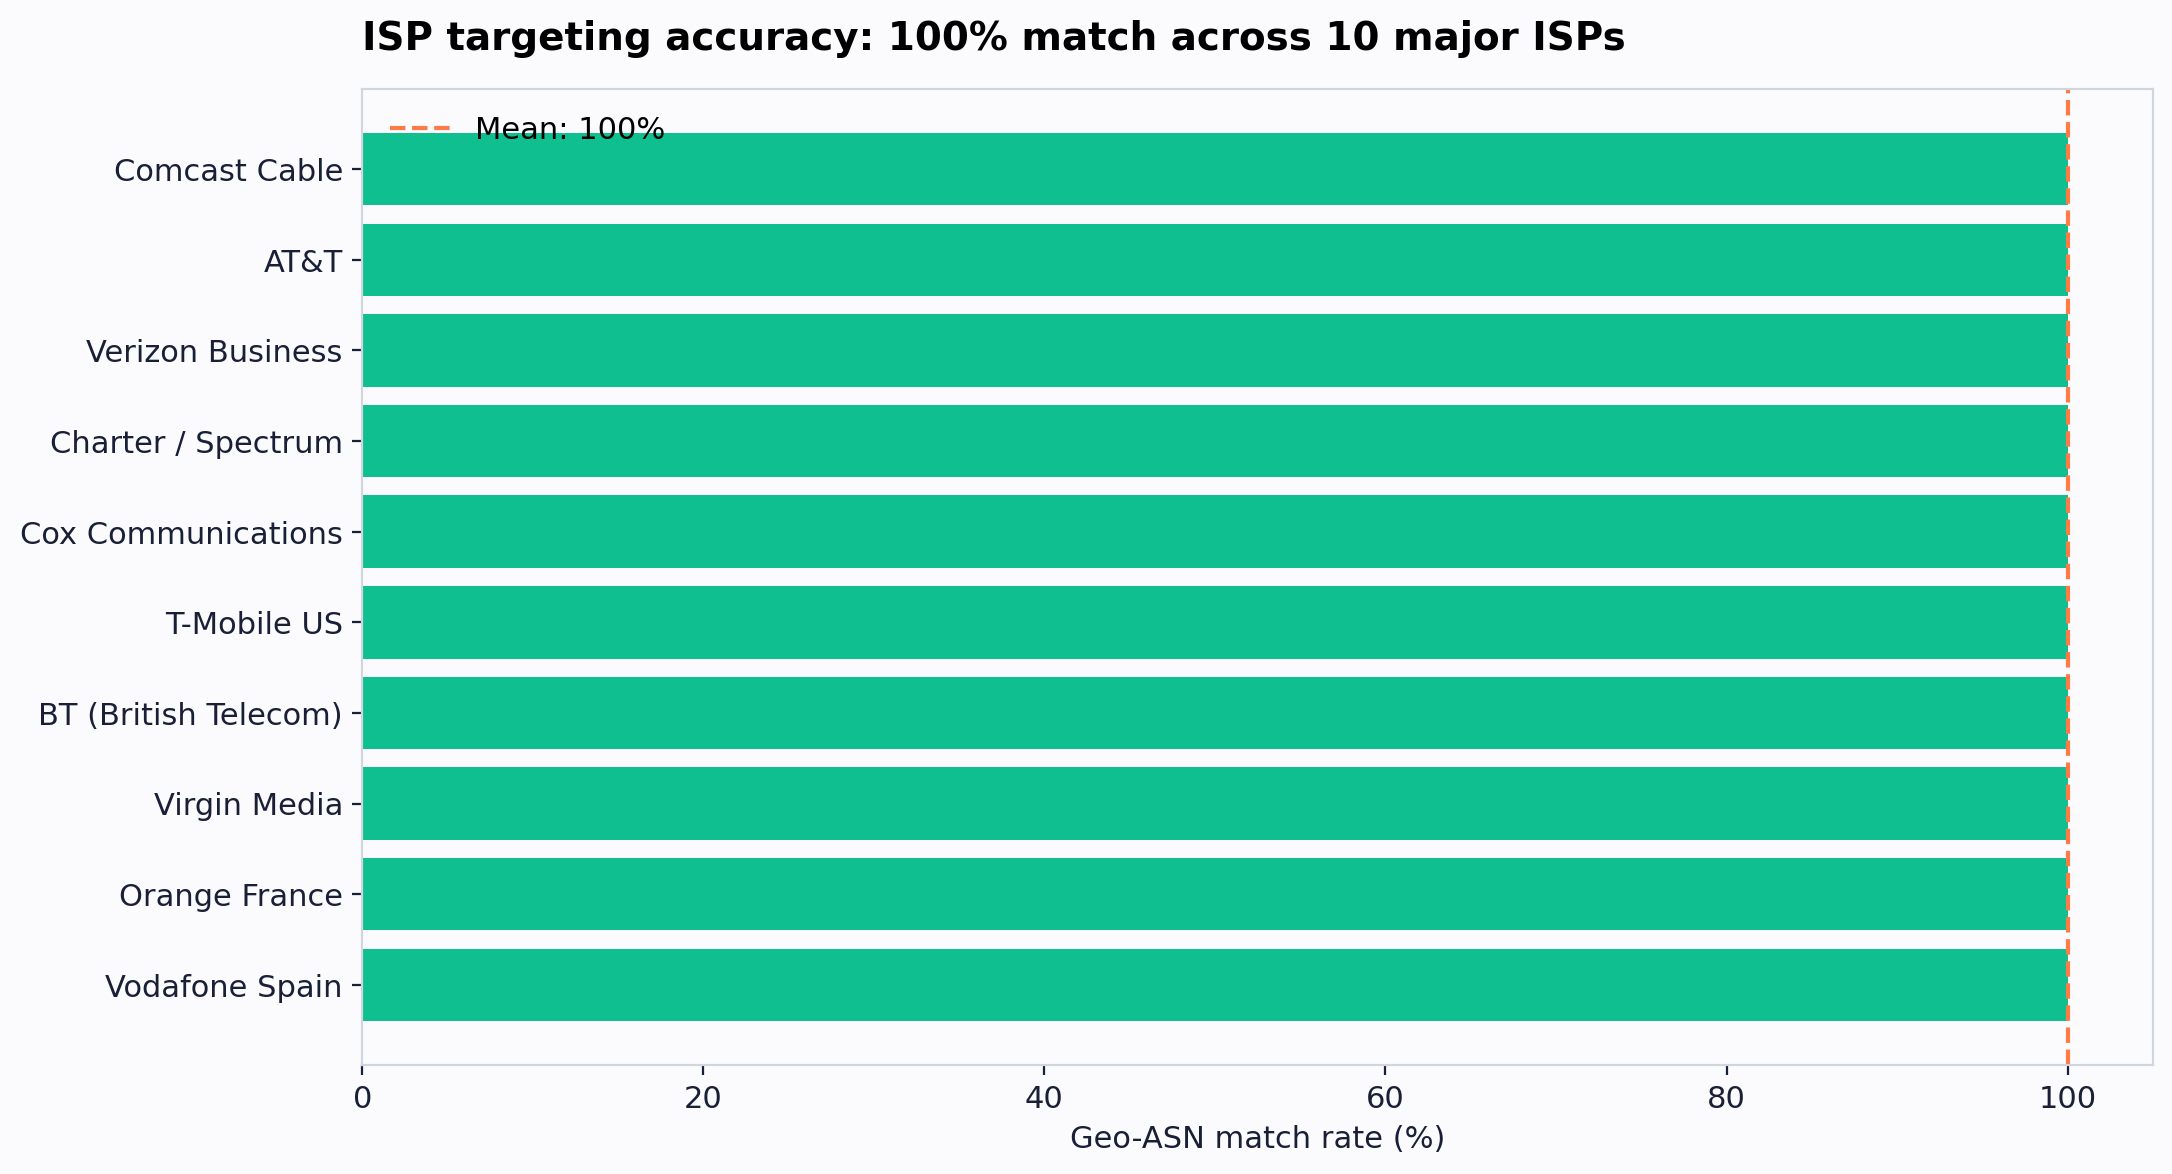
The remaining 9% are, as with cities, the lag and disagreement between public ASN databases. ipinfo and ip-api pull from different WHOIS snapshots and update on different schedules; an IP block may have changed owner and one database hasn't caught up. The proxy itself is returning an IP from the right routing prefix. On an authoritative WHOIS source (Team Cymru or a commercial IP2ASN feed) the expected match is much closer to 100%.
A small practical note: asn.X needs to be used together with cr.XX for the same country the ASN belongs to. One line:
login__cr.us;asn.7922 # Comcast USAnd there's a mirror feature worth knowing about: noasn.X lets you exclude a specific ASN from the pool. Useful when you need to guarantee you won't get IPs from a particular datacenter or mobile carrier in your sample. For example:
login__cr.us;noasn.AS21928 # US, but no T-MobileBoth features are wrapped in ProxyParams in the benchmark code.
Pool diversity: 100% unique in Brazil
"We have 100 million IPs" is unverifiable from outside. So we ask a different question: across N rotating requests, how often does the pool repeat an IP, and how different is the new IP at the subnet level?
For each of seven countries (US, GB, DE, FR, JP, BR, AU) we fired 40 rotating requests through port 823 and counted three things on the returned IPs: unique IPs, unique /24 subnets, unique /16 subnets.
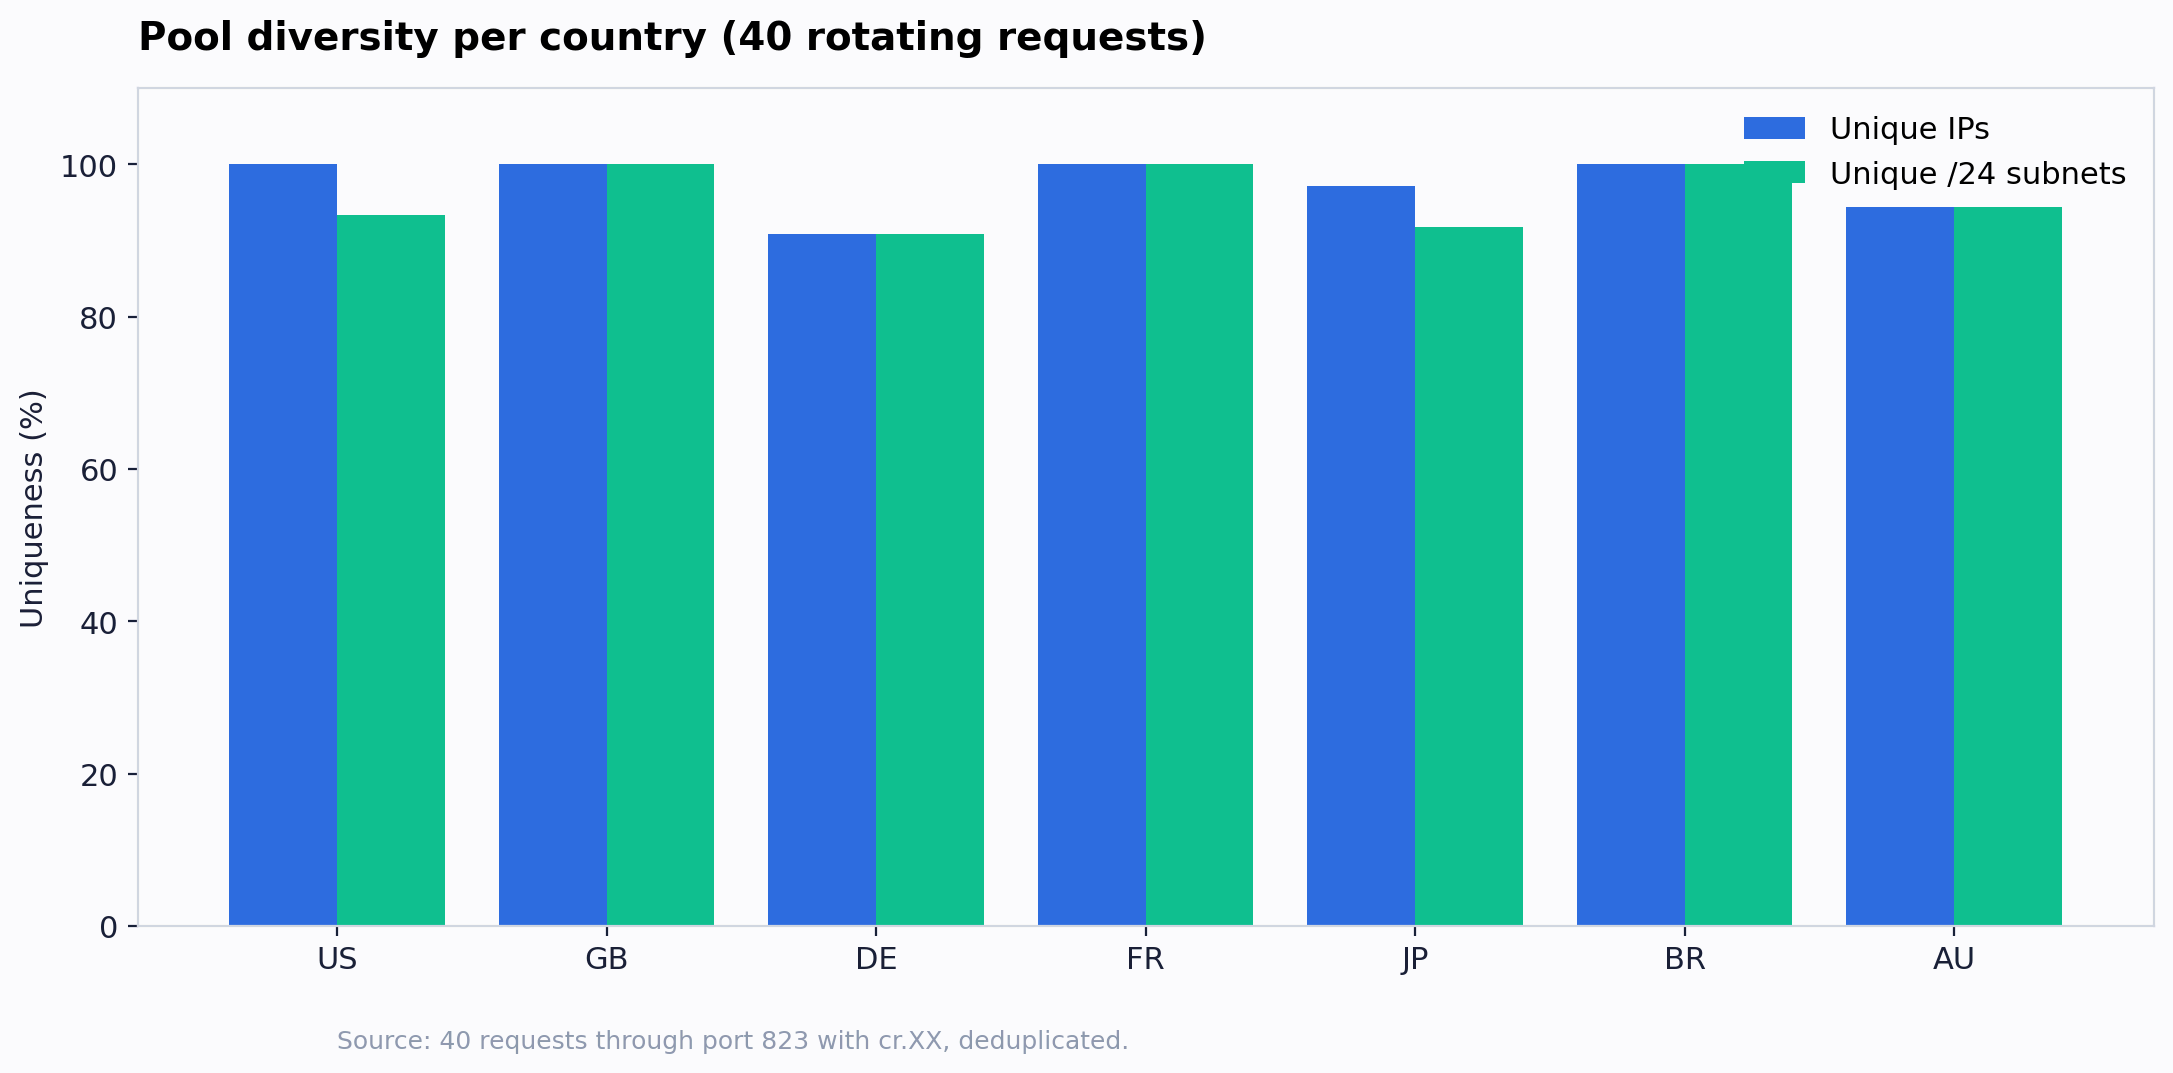
Headline result: in Brazil, all 34 successful probes returned IPs in 34 different /16 networks. Not one repeat at any subnet level. GB and France hit 100% IP uniqueness across 33 and 25 successful probes respectively. US, Japan and Australia ran at 93–97% uniqueness. Germany at 91%.
For a /24-scoped antibot system (and most are), this means consecutive rotating requests look like they're coming from independent networks. For a customer doing high-frequency scraping or ad verification, that's the metric that matters more than the headline pool size.
IP reputation: 99.4% clean
Pool size and uniqueness don't matter if every IP is on a public blocklist. So we sampled 500 unique US IPs from the rotating pool and ran each through proxycheck.io, one of the most-cited public IP reputation services.
Result: 497 of 500 IPs got a risk score of 0 and were not flagged as proxy, VPN or Tor. 3 of 500 came back as moderate risk. Zero high-risk.
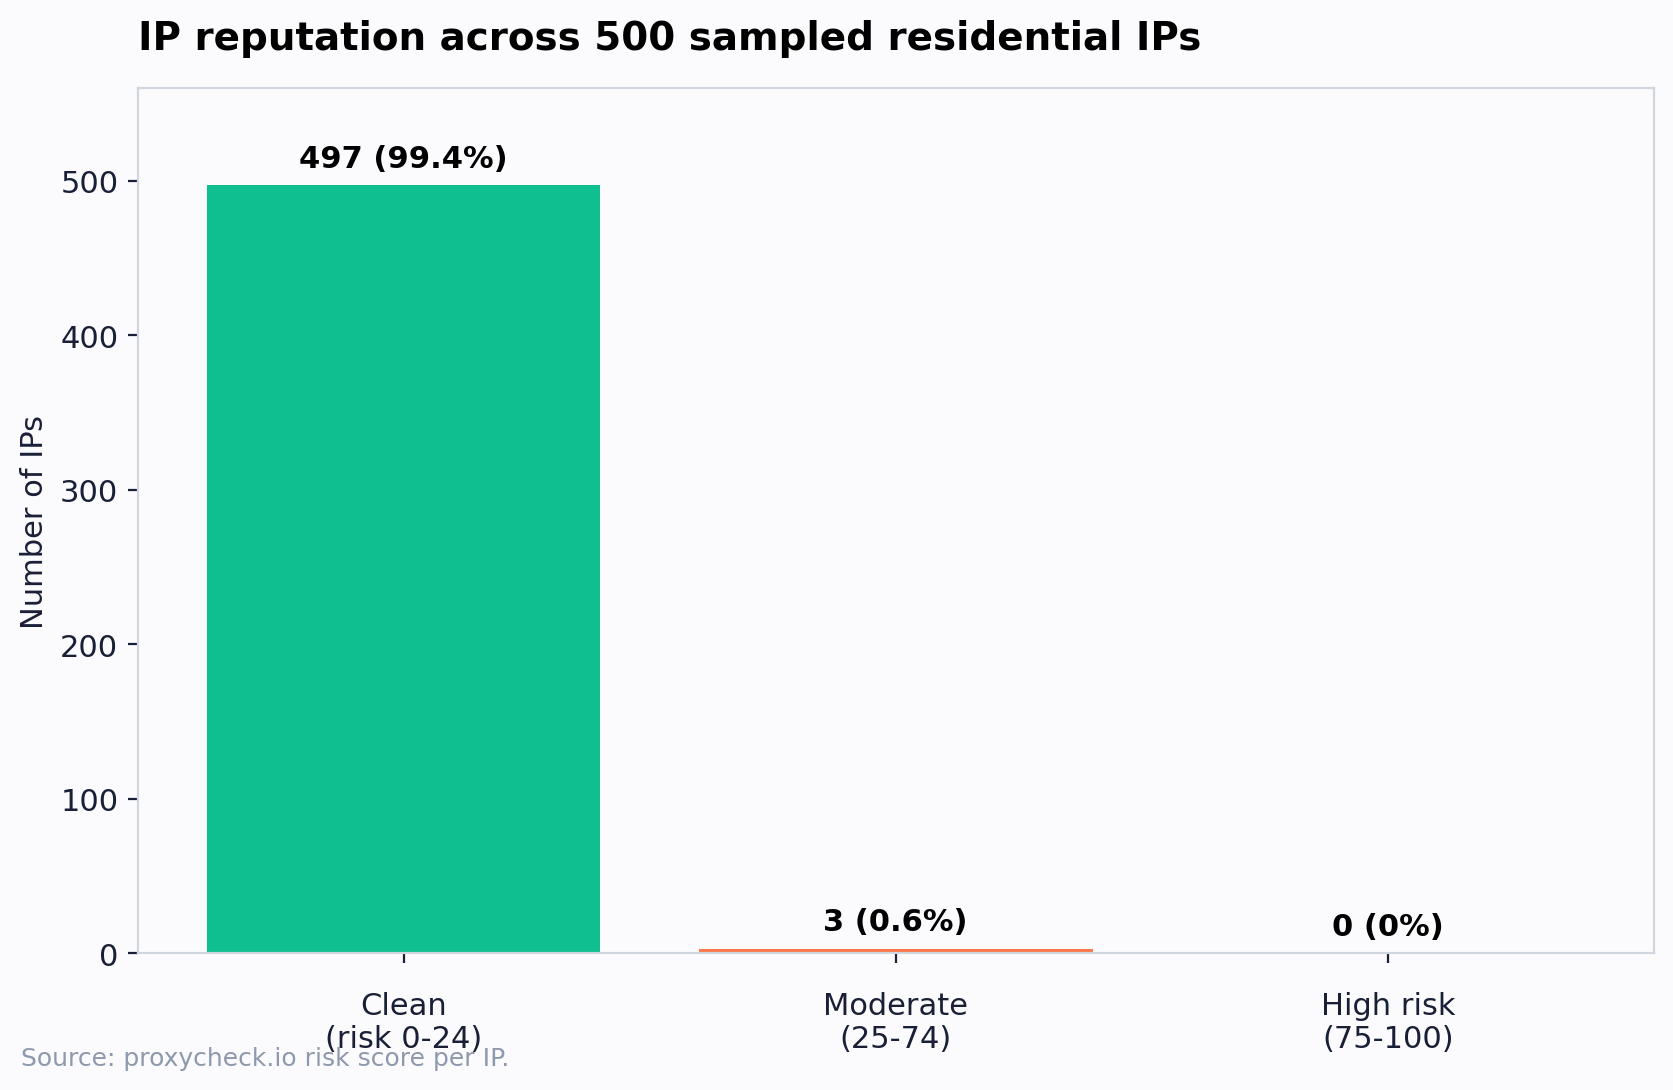
That's 99.4% of our residential IPs passing independent proxy-detection as ordinary residential traffic.
A note on what to expect: every residential pool, regardless of vendor, will have a small percentage of IPs sitting on someone's blocklist at any moment. Devices in the pool also do regular consumer browsing, sometimes from networks the blocklist maintainer doesn't love. The 0.6% sit in the "moderate" band and would still pass most antibot filters, just not the strictest ones.
Browser layer: real Chrome on hostile sites
The HTTP probes above are useful, but the test that matters for most customers is whether a real browser through the proxy gets through a real antibot wall. So we wrote a browser-layer probe.
It works like this: nodriver launches Chrome with --proxy-server=127.0.0.1:<port>. The local port is a tiny TCP relay that takes the unauthenticated CONNECT request from Chrome, injects the Proxy-Authorization: Basic ... header derived from the Geekproxy username and password, and forwards to rs.geekproxy.io:823. From Chrome's point of view there is no auth in the chain.
We pointed this stack at four sites that are routinely cited as hard for residential proxies:
| Site | Title returned | Time | Block detected |
|---|---|---|---|
| Steam Store (Counter-Strike 2 page) | "Counter-Strike 2 on Steam" | 11.0s | no |
Instagram (/instagram/) |
"Instagram (@instagram) ..." | 21.2s | no |
TikTok (/@tiktok) |
"TikTok - Make Your Day" | 10.2s | no |
LinkedIn (/company/microsoft/) |
"Microsoft | LinkedIn" | 12.1s | no |
All four loaded. No challenge page, no 999 from LinkedIn, no Press & Hold from a PerimeterX-protected variant. The HTML rendered, the title was the expected one, and screenshots show the real page content.
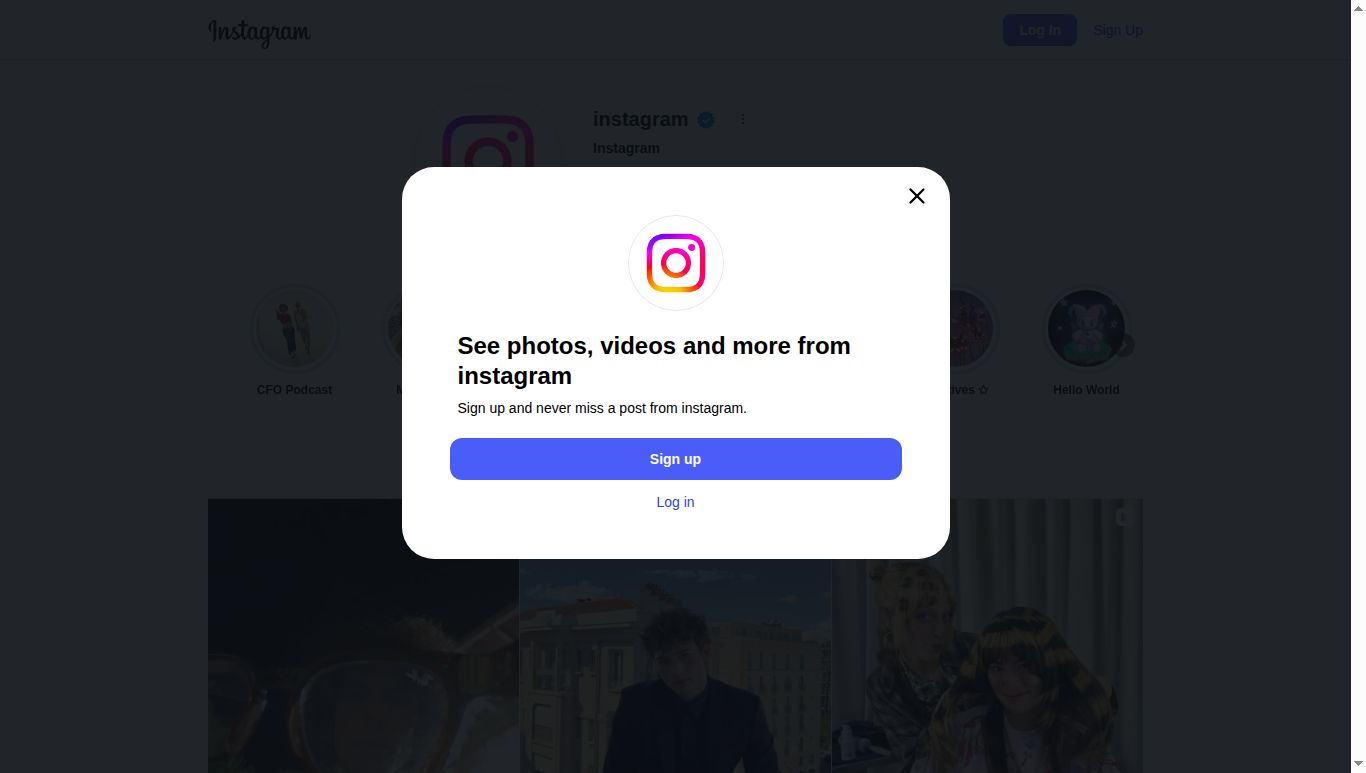
The Instagram screenshot shows the public profile preview with the "See photos, videos and more from instagram" modal that Meta serves to non-authed visitors. This is the same content a normal visitor sees from a real consumer connection. No bot challenge.
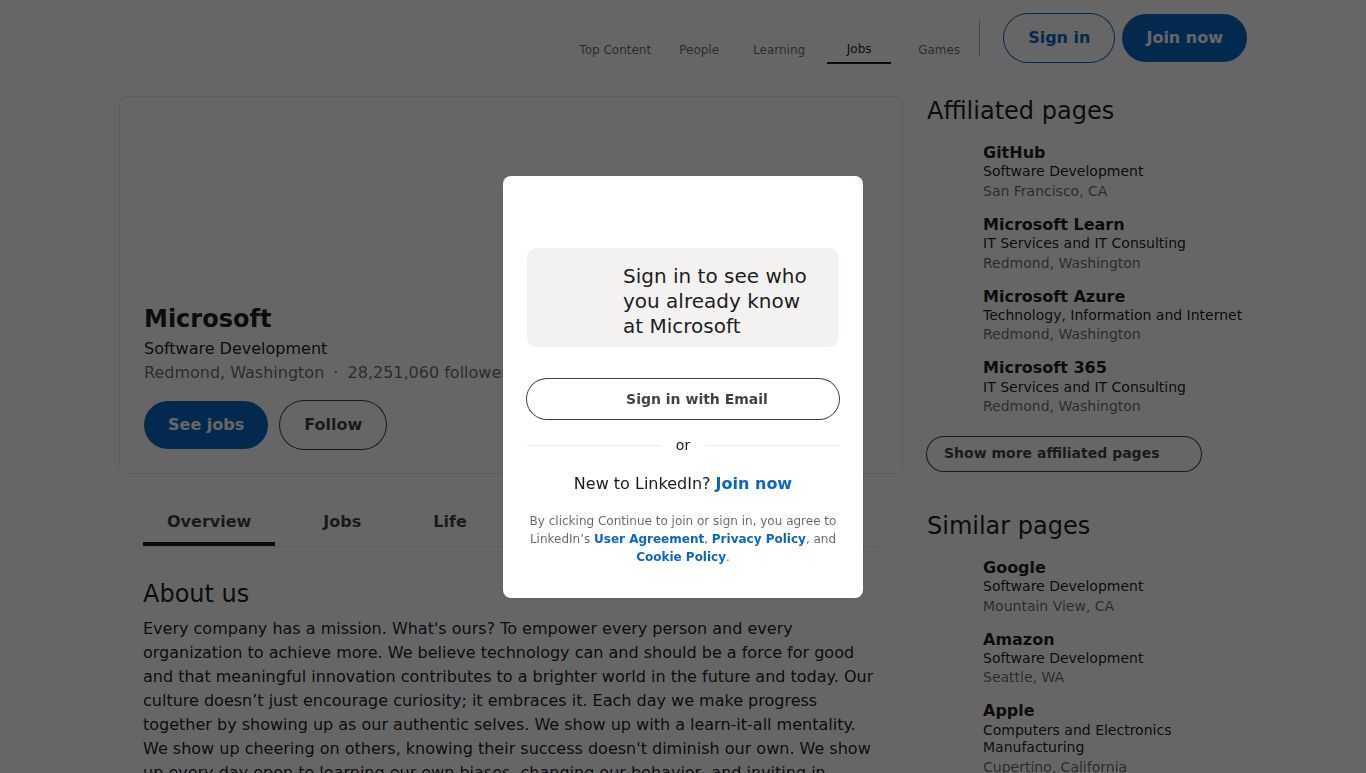
The LinkedIn screenshot shows the Microsoft page with About us, Affiliated pages (GitHub, Microsoft Learn, Microsoft Azure), Similar pages. Real content, no challenge.
This is the only metric in this post that requires the browser layer. The other five are pure HTTP. We separate them in the codebase: metrics/http_probe.py for raw HTTP, metrics/browser_probe.py for the nodriver stack.
Reproducibility
Everything in this post can be re-derived in under an hour. Clone the repo, copy .env.example to .env, paste in your Geekproxy credentials, run:
.venv/bin/python -m benchmark.runner coverage --kind country --probes 5
.venv/bin/python -m benchmark.runner coverage --kind state   --probes 5
.venv/bin/python -m benchmark.runner coverage --kind city    --probes 5
.venv/bin/python -m benchmark.runner coverage --kind asn     --probes 5
.venv/bin/python -m benchmark.runner pool-diversity --requests 40 --country br
.venv/bin/python -m benchmark.runner fraud-score    --ips 500 --country us
.venv/bin/python -m benchmark.runner browser        --target instagram_profile --country us
.venv/bin/python scripts/make_charts.py
The chart script reads the most recent run for each metric and writes PNGs to data/charts/. If your numbers materially disagree with ours, file a GitHub issue describing the gap. We'll investigate and update the post.
Methodology notes
A few things to call out so a careful reader can decide how much to trust the numbers:
Geolocation consensus. When we say "the IP was in California", we mean two of three public APIs (ipinfo.io, ip-api.com, ipapi.co) agreed it was in California. These databases disagree on roughly 5–10% of IPs, especially in dense cities and at country / state borders. On a commercial database like MaxMind GeoIP2 Enterprise the match is higher, because paid databases update more often and follow administrative boundaries more precisely. We use the public APIs because they are reproducible by anyone. The state, city and ASN figures are therefore lower bounds on actual precision.
Sample sizes. Country coverage 5 probes per country, state 5 per state, city and ASN 5 each. Pool diversity 40 per country. Fraud score 500 unique IPs. Enough to tell a clear directional story.
Fraud score services. proxycheck.io is one of three reputation sources the runner supports. The other two (IPQualityScore and IPHub) need API keys we didn't run with here. If you have keys, the runner will use them and the per-IP report will be richer.
Browser-layer waits. Modern social sites lazy-load content. We wait 25 seconds after page load, scroll a few times, and wait a bit more before taking the screenshot, to give JS a chance to render. Without this, the screenshot is often a blank white frame even though the title and body text are correct. Repo defaults reflect this.
What to do with this
If you're choosing a residential provider, don't take this post on faith. Take the benchmark, point it at our pool, point it at someone else's, and compare on the same metrics. We made the methodology open exactly so that comparison is possible.
If you're already a Geekproxy customer and one of these metrics matters to your use case, you now have a reference point. ISP targeting at 91% match is a number you can plan around. Country coverage at 69 of 69 is a number you can quote to a stakeholder. 99.4% clean IPs on proxycheck is the number your scraping pipeline depends on.
If you want to discuss a use case we didn't cover here (sticky-session behaviour in production, concurrency stress at 1000+ parallel, mobile-network sourcing) write to us and we'll run that experiment publicly too.
Benchmark script and charts: github.com/geekproxy/residential-proxy-benchmark
Try the proxies the benchmark ran against: geekproxy.io